- Story
- Discovery
- Problem validation
- Solution 1
- Solution 2
- Solution validation
- Considerations
- Application remarks
- Resources
In this post I cover a specific performance issue that requires adjustment of ASP.NET thread pool limits. Changing default thread pool limits in ASP.NET application requires solid understanding of the issue you’re trying to solve.
TL;TR
If you observe page response time degradation on Sitecore CD role that matches configuration ofpollingIntervalsetting onprivateandsharedsession state providers when experience data collection is enabled, you can tweak ASP.NET application thread limits to mitigate the issue.
For Azure PaaS solutions, you can use Sitecore-ThreadPool-Configurator plugin.
Story
I got involved in troubleshooting a few performance issues reported by several customers (Sitecore 8). The environments were different (VM-based vs. Azure WebApp) and scenarios didn’t match (steady traffic vs. influx of traffic) and yet the underlying problem was reported to be the same - slow page response time on CD instances.
With steady traffic it was possible to observe issue occurrence pattern while with traffic surge the issue was observed but the pattern wasn’t obvious.
Discovery
Collection and analysis of memory dumps showed some similarities but also had some differentes that made it difficult to say whether root cause is the same. For example:
- several memory dumps had lots of
/SESSION ENDrequests in HttpContext stack - surging traffic had most memory dumps with high CPU while steady traffic had low CPU usage
In all cases session state store didn’t seem to cause a problem that could lead to the performance issue. In Azure PaaS it was easy enough to scale up the App Service tier to mitigate the issue. After that a pattern started emerging while looking at CPU and Requests Queued performance counters for entire service. Since it’s not trivial to get real-time performance counters stats for a particular instance of Azure WebApp, it was difficult to pinpoint the culprit of the issue.
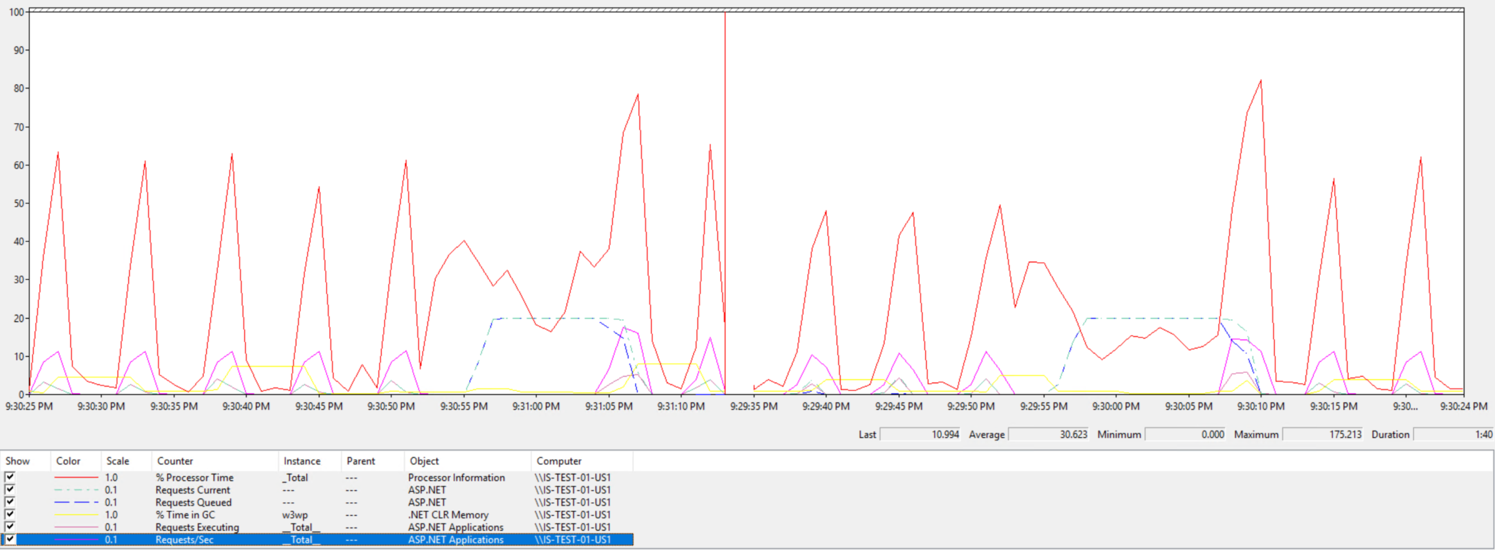
However, in VM-based environment it was possible to fire up Performance Monitor and watch the counters in real-time. The pattern was showing that every minute the Requests Queued counter started growing and page response time was degrading. The counter would climb up for serveral seconds and then drop down sharp while CPU would spike up. One of first guesses fell onto Session_End processing mechanism. Session state providers were configured to pull expired sessions every minute to process them.
By default each Sitecore CD instance is configured to pull expired sessions from sesstion store database and process them. When the mechanism is triggered, it follows these steps:
- create a job that pulls expired sessions one-by-one
- deserialize sessoin data
- issue
/SESSION ENDrequest and attach session data to it - trigger pipelines to write session data (a.k.a. experience data) into collection database
Problem validation
To validate discovered pattern I created a simple JMeter script to generate load to my local Sitecore instance. I set both session state providers pollingInterval="60" (i.e. 1 min) and session timeout to 1 min.
As the test was in third minute of testing I started getting the pattern I was looking for. The Requests Queued and CPU perf. counters looked like this:
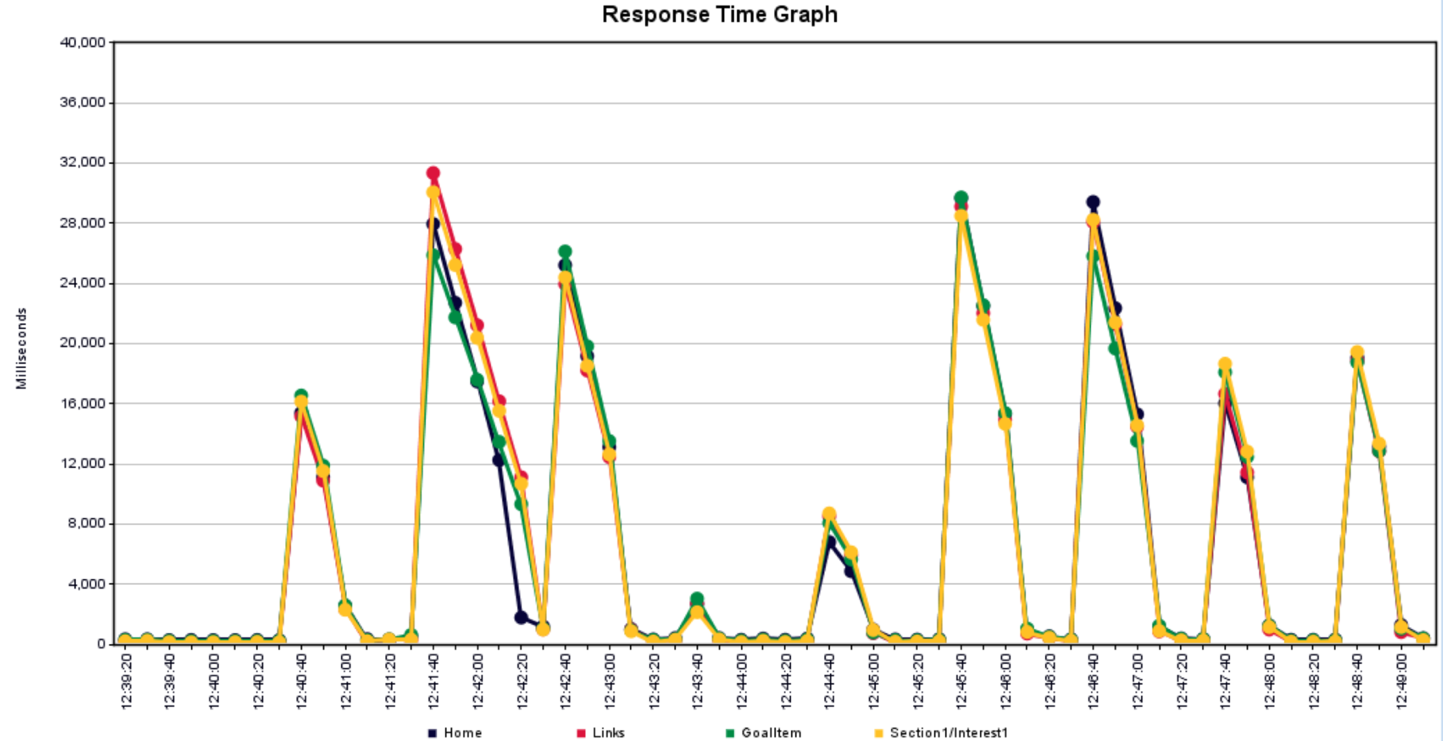
In the end page response time graph showed this:
Solution 1
See Application Remarks for Sitecore 9 versions.
Since each CD instances queries out-of-proces session store, one can configure some CD roles to be dedicated instances to process expired sessions and let other CD roles to focus on handling incoming visitors’ traffic.
At the moment of writing this post only Redis sessions state provider had configuraton setting that allowed to disable session pulling mechanism. Other providers (i.e. SQL and MongoDB) did not have such sessing out of the box.
By default Azure WebApp uses Redis session state provider. So, it was simple enough to reconfigure CD role to disable session pull for one WebApp service. Then create another WebApp service where session pull was enabled.
This solution is preferred approach as it allows to move session processing workload to dedicated CD instances that are not exposed to public and as such would not slow down page rendering.
However, if you use VM-based environment that can take a long time (i.e. >1 hour) to setup dedicated CD instances or have other restrictions that do not allow you to add more CD instances, you can explore Solution 2.
Solution 2
See Application Remarks for Sitecore 9 versions.
Since the issue happens because application artificially creates traffic surge by issuing lots of /SESSION END requests, we can allocate additional threads for the application upfront in order to help it process these types of requests faster.
This can be done by setting minWorkerThreads, minIoThreads, maxWorkerThreads and maxIoThreads on <processModel> section in machine.config file. The configuration would look like this:
<processModel autoConfig="true" maxWorkerThreads="200" maxIoThreads="200" minWorkerThreads="50" minIoThreads="50"/>
Besides <processModel> settings, you can adjust <httpRuntime> configuration to include minFreeThreads and minLocalRequestFreeThreads. Example configuration:
<httpRuntime minFreeThreads="176" minLocalRequestFreeThreads="152" .../>
Azure WebApp services does not provide access to machine.config file. Therefore, if you want to apply this solution to Azure WebApp instances, you can use API-based configuration: Sitecore-ThreadPool-Configurator.
Solution validation
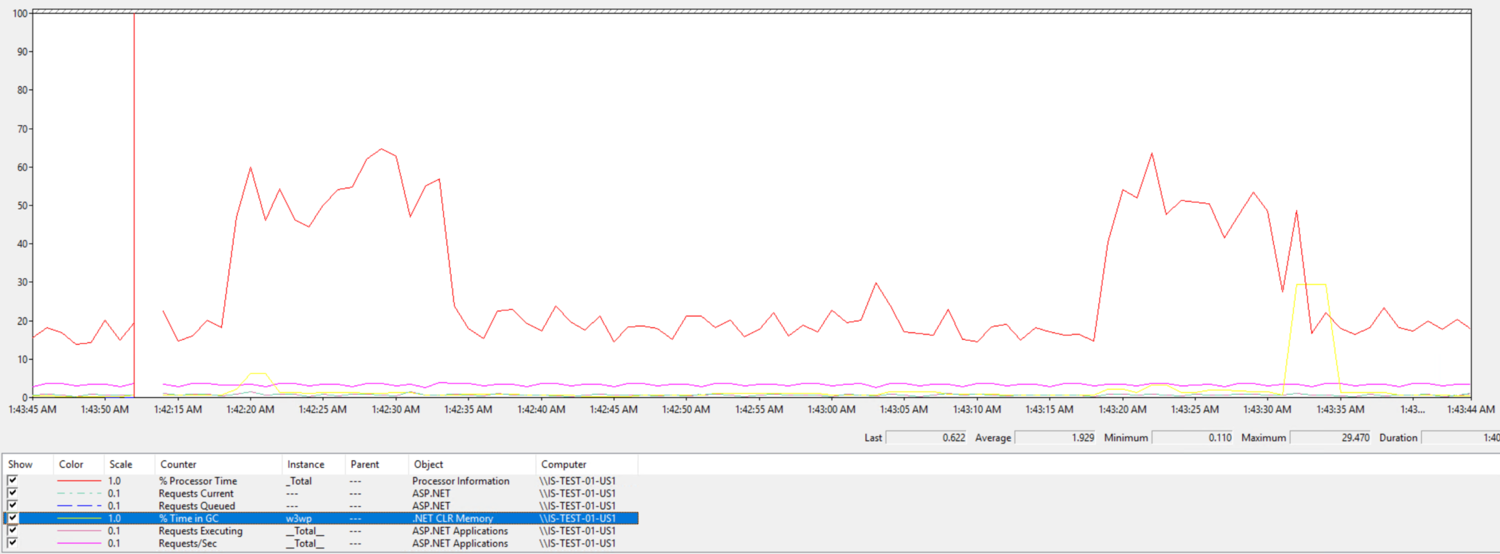
After adjusting application thread limits and repeating the test, the impact caused by session processing was not merely noticeable. The perf. conter chart looked like this:
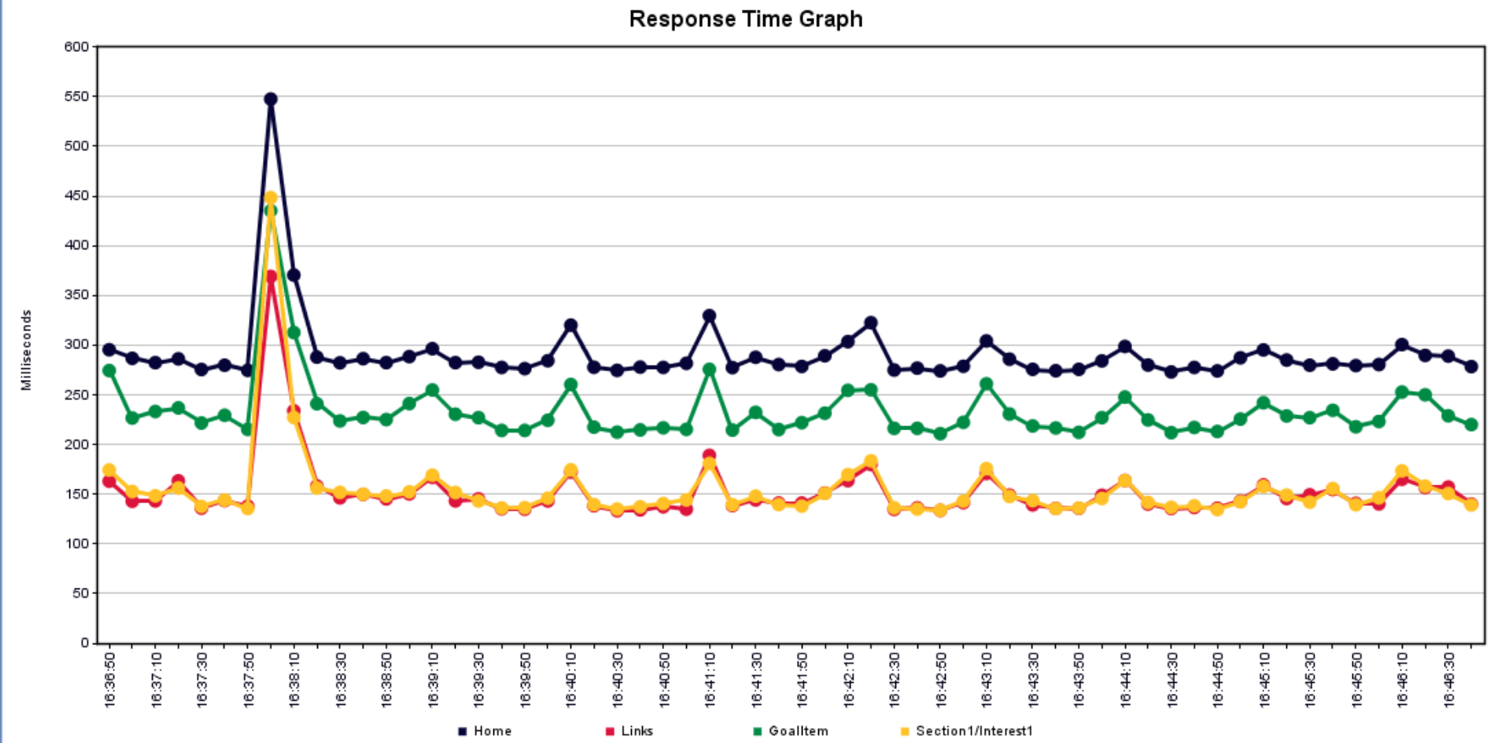
The page response time graph looked like this:
Considerations
Configuring ASP.NET application to pre-create a number of threads can help to mitigate performance degradation caused by surging requests. However, it’s important to understand that by pre-allocating resources to handle certain condition, we shift responsibility from one area to another. In this example application was no longer queueing requests as there were more available threads to accept incoming requests and therefore process them faster. The faster handling resulted in higher CPU for the time when requests were surging. If you don’t have CPU head room, tempering with thread pool can backfire and result in maxed out CPU resource.
Application remarks
In Sitecore 9 a new processor was introduced to make application adjust its thread limits dynamically based on available threads.
<pipelines>
  <initialize>
    <processor type="Sitecore.Analytics.Pipelines.Loader.StartThreadPoolSizeMonitor, Sitecore.Analytics"/>
  </initialize>
</pipelines>
This processor uses accelerationRate, decelerationRate parameters to set thread limit adjustment strategy and updateInterval parameter to establish frequency with wich the app checks thread availability.
You can see the following INFO record in the log when Sitecore app starts:
INFO Initialized ThreadPoolSizeMonitor with parameters accelerationRate: 50, decelerationRate: 1, updateInterval: 00:00:00.5000000
If you enable DEBUG logging level, you’ll see the following entry when check occurs:
DEBUG Min threads: 8, Active threads: 0.
When thread pool limits are adjusted, you’ll see corresponding DEBUG log entries.